

What we set up
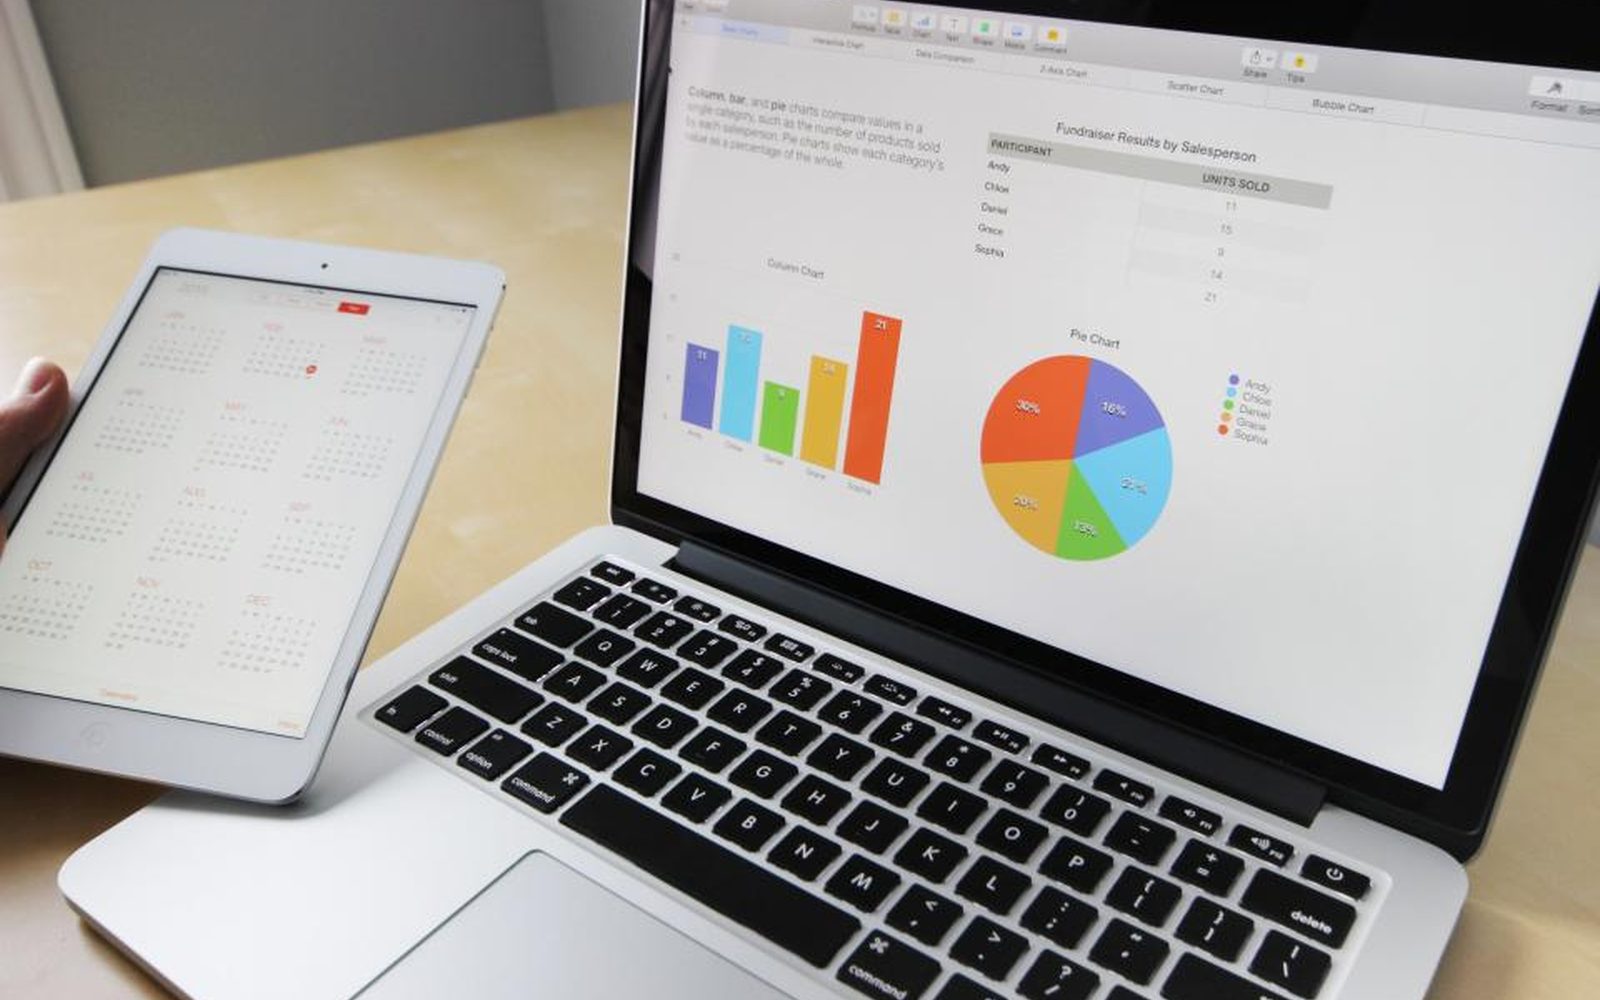
Most small teams already have the numbers. They sit in Square, Meta Business Suite, Google Sheets, and your accounts. What's missing is the hours to pull them together, so the report gets built by hand on a Sunday or lands too late to act on. Reports that write themselves (the industry calls it automated reporting) gather those numbers for you, lay them out the same way every time, and draft the plain words that explain them. You read the draft, add what only you know, and send it. You get a monthly report like a bigger business would have, without hiring anyone to build it.
Get your AI Starter Plan
Where you’re stuck right now
If a few of these sound familiar, you’re in good company.
- Reports are built by hand. Someone spends a day or two each month copying numbers into slides or a sheet, and the report lands late.
- The numbers don’t match. Your store says one thing and your accounts say another, and you’re not sure which to trust.
- The report gets skipped. It’s the first thing to go in a busy week, so you make calls on gut feel instead.
- You tried an AI tool and it made up a number. It sounded sure of itself, it was wrong, and you stopped using it.
Why a dashboard or an AI tool on its own falls short
A dashboard built on numbers that don’t agree makes the muddle look tidy. An AI tool asked to read the same numbers can give you a confident answer that’s wrong, and a wrong number is worse than none, because you might act on it. So the hard part is agreeing what each number means and getting the numbers clean first.
How we set it up
We keep it small and show you a useful report early.
- Start with the report you already build. We take the report that eats the most time and work back to the numbers behind it.
- Gather and match the numbers. We pull the figures from your apps and match them up, so the totals agree.
- Agree what each number means. We write down what counts as a sale, a returning client, or a meal served, so it doesn’t change between reports.
- Draft the first report. We check it against the last one you built by hand, and fix anything that doesn’t match.
- Hand over the words, keep the calls. An AI helper (the industry calls it an agent) drafts the plain commentary. You add the notes only you can write, and you decide what happens next.
What changes in your week
A four-person social media agency we work with built 18 monthly client reports by hand from Meta and Instagram numbers. It took two full days a month. Now the reports pull the numbers and draft the commentary in Google Slides, and the whole set takes half a day. The strategy notes are still written by the account lead, because that’s what clients pay for.
A four-person fashion boutique used to count sell-through by hand every Sunday to decide what to reorder. Now a report built from Square sales lists what sold, what’s sitting, and suggested reorders. The Sunday stocktake is gone. The buying decisions stay with the owner.
The questions a good report answers
Good reporting answers real questions in plain words. These are the ones small teams ask most.
- Sales. What sold, what sat, and what should I reorder?
- Clients. How did each client’s month go, and what should we tell them?
- Bookings. Who came back, and who hasn’t booked again?
- Funders. How many meals, homes, or people did we help this quarter?
We start with the one report that would change a decision this month, and build out from there.
Keeping your numbers true over time
Reports drift when nobody looks after them. An app adds a field, a product gets renamed, and the totals stop lining up without anyone noticing. We stop that by writing down how each number is built and keeping the report running as your apps change. That’s part of your package, so you’re not left with a report that quietly goes stale.
Reports by industry
The report worth handing over first differs by business. See where it fits in marketing and creative agencies, fashion, not-for-profits, and e-commerce.
When the numbers live in too many places to report on, start with connecting your tools or one home for your data.
What we set up
Numbers pulled together
Figures from the apps you already use, gathered and matched on a schedule, so nobody exports and pastes them by hand.
A report in the same shape each time
The same layout every week or month, so you and your clients or funders can compare at a glance.
The words drafted for you
An AI helper drafts the plain commentary, like what sold, what sat, and what changed, for you to check and add to.
One meaning for each number
We agree what each figure means, like a sale, a returning client, or a meal served, so two reports can't disagree.
Suggestions you decide on
Where it helps, the report suggests a next step, like a reorder, and leaves the decision with you.
Reports that write themselves for small teams

Monthly client reports at a four-person social media agency

A reorder report at a four-person fashion boutique

A grant report at a community food relief charity
Small teams we work with
How a four-person social media agency cut 18 monthly client reports from two days to half a day
How a four-person fashion boutique replaced its Sunday stocktake with a report from Square
How a community food relief charity cut its quarterly grant report from a week to about a day
Common questions
What kind of reports can write themselves?
Will AI get the numbers wrong?
Do I need to clean up my data first?
Can it write the personal parts too?
Do I need to change my apps?
How soon do I see the first report?
Is my data kept private?
Find the report worth handing over first
Tell the AI about your business, your goals, and where your week goes. Your plan will show which report to hand over first.
Get your AI Starter Plan